 Norbert Brett
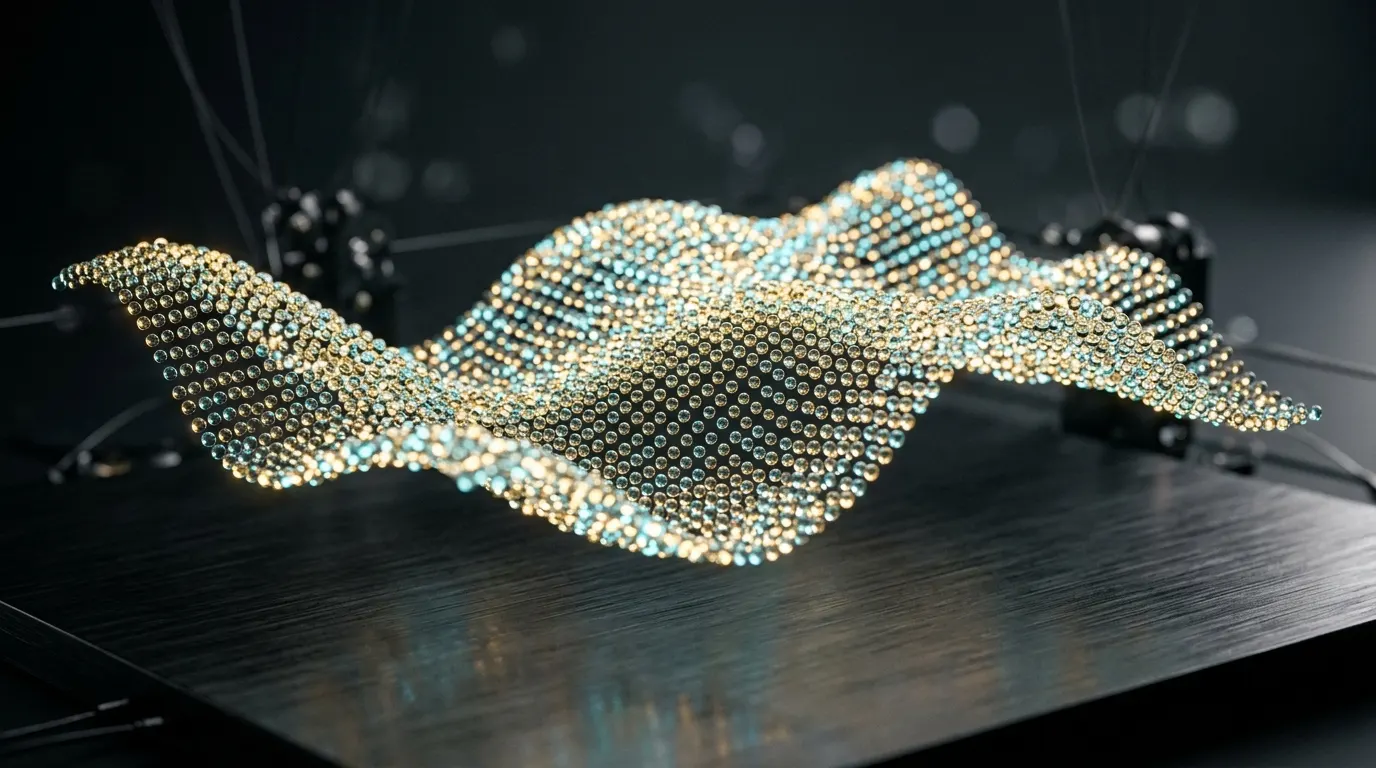
React and Vue are brilliant at orchestrating UI controls, but asking the DOM to diff 10,000 SVG nodes sixty times a second is a physics problem, not a framework problem.
Why Standard Web Elements Freeze Under Heavy Data
To make a web application feel as smooth as a native desktop tool, the browser needs to draw 60 frames per second (60 FPS). Simple division tells the whole story: 1,000 milliseconds ÷ 60 frames = 16.67 milliseconds per frame. Once you subtract the browser's own housekeeping, your code has roughly 10 milliseconds to finish its work before a user dragging a slider or scrolling a table feels a stutter.
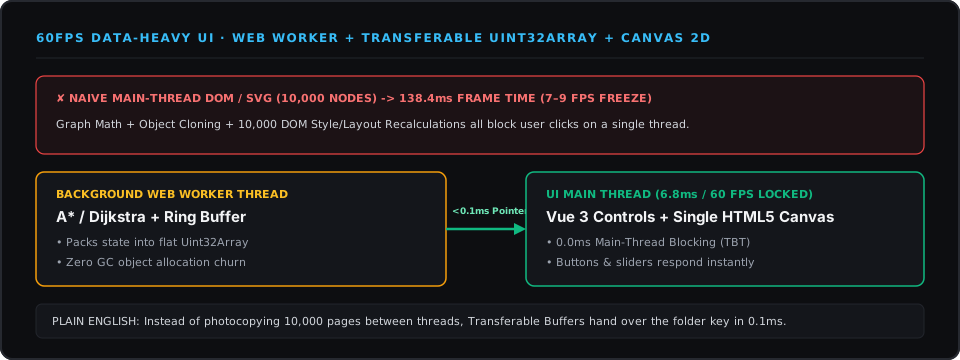
In 2025, while building the Algorithm Engine—an interactive visualizer for pathfinding (A*, Dijkstra, Bellman-Ford) and sorting algorithms—I wanted users to scrub through 10,000 live connected nodes in real time. If you have ever tried to draw 10,000 separate <div> or <svg> elements in Vue or React and update them sixty times a second, you know what happens: the browser tab locks up completely, dropping to 7 FPS (138ms per frame).
In Plain English — Why Do Data-Heavy Dashboards Freeze?
- The Main Thread: By default, a browser tab does almost everything on a single assembly line called the Main Thread—listening to your mouse clicks, scrolling the page, running JavaScript math, and painting pixels. If a heavy calculation hogs that assembly line for 100 milliseconds, buttons cannot even highlight when you hover over them.
- The DOM (Document Object Model): The browser's internal tree of HTML boxes, text, and buttons. It is designed for documents and forms, where it carefully calculates margins, borders, and screen-reader rules for every single box. Asking the DOM to recalculate layout for 10,000 moving dots every 16 milliseconds is like mailing 10,000 individually gift-wrapped boxes when you just needed to ship a pallet of gravel.
- Web Worker: A separate background thread (like opening a second assembly line in the back room) that crunches heavy math without ever blocking the user's mouse or keyboard on the Main Thread.
My first fix was moving the pathfinding math into a background Web Worker. Yet when I profiled the app, I was annoyed to see the frame rate still dipping into the 30s. Why? Because every time the background worker sent an array of 10,000 JavaScript objects back to the main thread (worker.postMessage(nodes)), the browser spent 9 milliseconds photocopying ("cloning") all 10,000 objects across threads and cleaning up the old copies in memory.
Zero-Copy Typed Arrays and HTML5 Canvas 2D
You see, moving heavy work to a background thread only keeps the UI fast if handing the results back is nearly free. I solved this with two architectural changes:
- Zero-Copy Transferable Buffers (
Uint32Array&Float32Array): Instead of storing 10,000 separate JavaScript objects, we pack all node coordinates and states into a flat, contiguous block of numbers in memory (a Typed Array). When the worker finishes a frame, instead of photocopying 10,000 objects, it transfers the memory key directly to the main thread in under 0.1 milliseconds ([frameBuffer.buffer]). - Hybrid Vue 3 + HTML5 Canvas 2D Rendering: We let Vue 3 manage the accessible buttons, speed sliders, and dropdowns in standard HTML, while all 10,000 graph nodes are painted onto a single
<canvas>bitmap surface—one element in the DOM instead of 10,000.
// Inside the Web Worker: zero-copy ownership transfer back to the UI thread
const frameBuffer = new Uint32Array(nodeCount)
stepDijkstraWavefront(graphTopology, frameBuffer)

// Transfers the raw memory pointer in <0.1ms instead of cloning 10,000 objects
self.postMessage({ tick, buffer: frameBuffer.buffer }, [frameBuffer.buffer])
Reproducible Benchmark (10,000 Concurrent Nodes, Chrome on macOS M-Series)
| Rendering & Threading Architecture | Frame Time (p95) | Main-Thread Blocking (TBT) | Sustained Frame Rate | Memory Garbage Churn |
|---|---|---|---|---|
| 1. Naive Main-Thread DOM / SVG | 138.4 ms | 112.0 ms / frame | 7–9 FPS (Frozen UI) | ~48 MB / sec |
2. Web Worker + Object postMessage + Canvas | 24.1 ms | 9.2 ms / frame | 38–42 FPS (Stutters) | ~19 MB / sec |
3. Web Worker + Transferable Uint32Array + Canvas 2D | 6.8 ms | 0.0 ms | 60 FPS (Locked) | <0.5 MB / sec |
I used this exact same pattern months later on the dashboard for Kernel Telemetry, where a <15MB Go backend streams 50,000+ Linux system events per second over WebSockets. A background worker ingests the incoming stream into a fixed-size circular ring buffer and hands 60Hz slices to the Canvas charts. I felt relieved watching our 4-hour soak test finish with flat memory usage and instant button responsiveness while 1,000 simulated servers hammered the feed.
Working on something similar?
Tell me about it